Rising Terminal Utilization Limits Trade Route Recovery from Minor Freight Delays

High terminal utilization means single-day port delays now require a week of recovery, extending buyer transit windows.
28.08.26 2 min

Briefing

Global average vessel waiting times have nearly doubled since 2019, according to maritime consultancy Drewry, as terminal operators prioritized cost cuts over operational resilience. For procurement managers, this shift means minor disruptions like a single day of bad weather or labor halts now require a full week of recovery before cargo flows normalize. The core problem is capacity: port capacity across major global hubs expanded by just 21% since 2019 while cargo volumes rose 28%.

A weathered industrial rail wheel and rusted linkage connect to a painted steel plate with a brass grommet on a concrete ledge.

Context

Procurement desks historically blamed port congestion on under-investment in physical terminal infrastructure. Buyers waited to see whether billions in planned terminal funding would resolve delays. The central question was whether recurring delays in recent years were a temporary backlog or a lasting symptom of outdated cargo facilities.

A green perennial plant emerges through cracked concrete slabs above a discarded metal hydraulic cylinder resting on gravel ground.

Analysis

Terminal operators prioritize high berth utilization to maximize financial returns, eliminating the operational buffer needed to absorb delays. At 90% utilization, a terminal takes about a week to clear the backlog from a single day of closure. At 75% utilization, that same delay is cleared in two days. Shippers bear the cost of this trade-off. Delayed vessels arrive in clusters, creating a secondary bottleneck at the berth. Carriers then alter schedules by cancelling voyages, forcing shippers to handle sudden spikes in cargo rollovers and carry larger safety stocks.

An illuminated data display module containing ascending wooden height blocks stands on a concrete industrial lock platform above dark water channels.

Parameters

  • Volume Growth ~ 28% increase in cargo volumes across major ports from 2019 to 2026.
  • Capacity Expansion ~ 21% expansion in port terminal capacity since 2019, trailing trade demand.
  • High Utilization Recovery ~ Seven days needed to clear backlogs from a single day of disruption at 90% utilization.
  • Low Utilization Recovery ~ Two days needed to clear backlogs from a single day of disruption at 75% utilization.
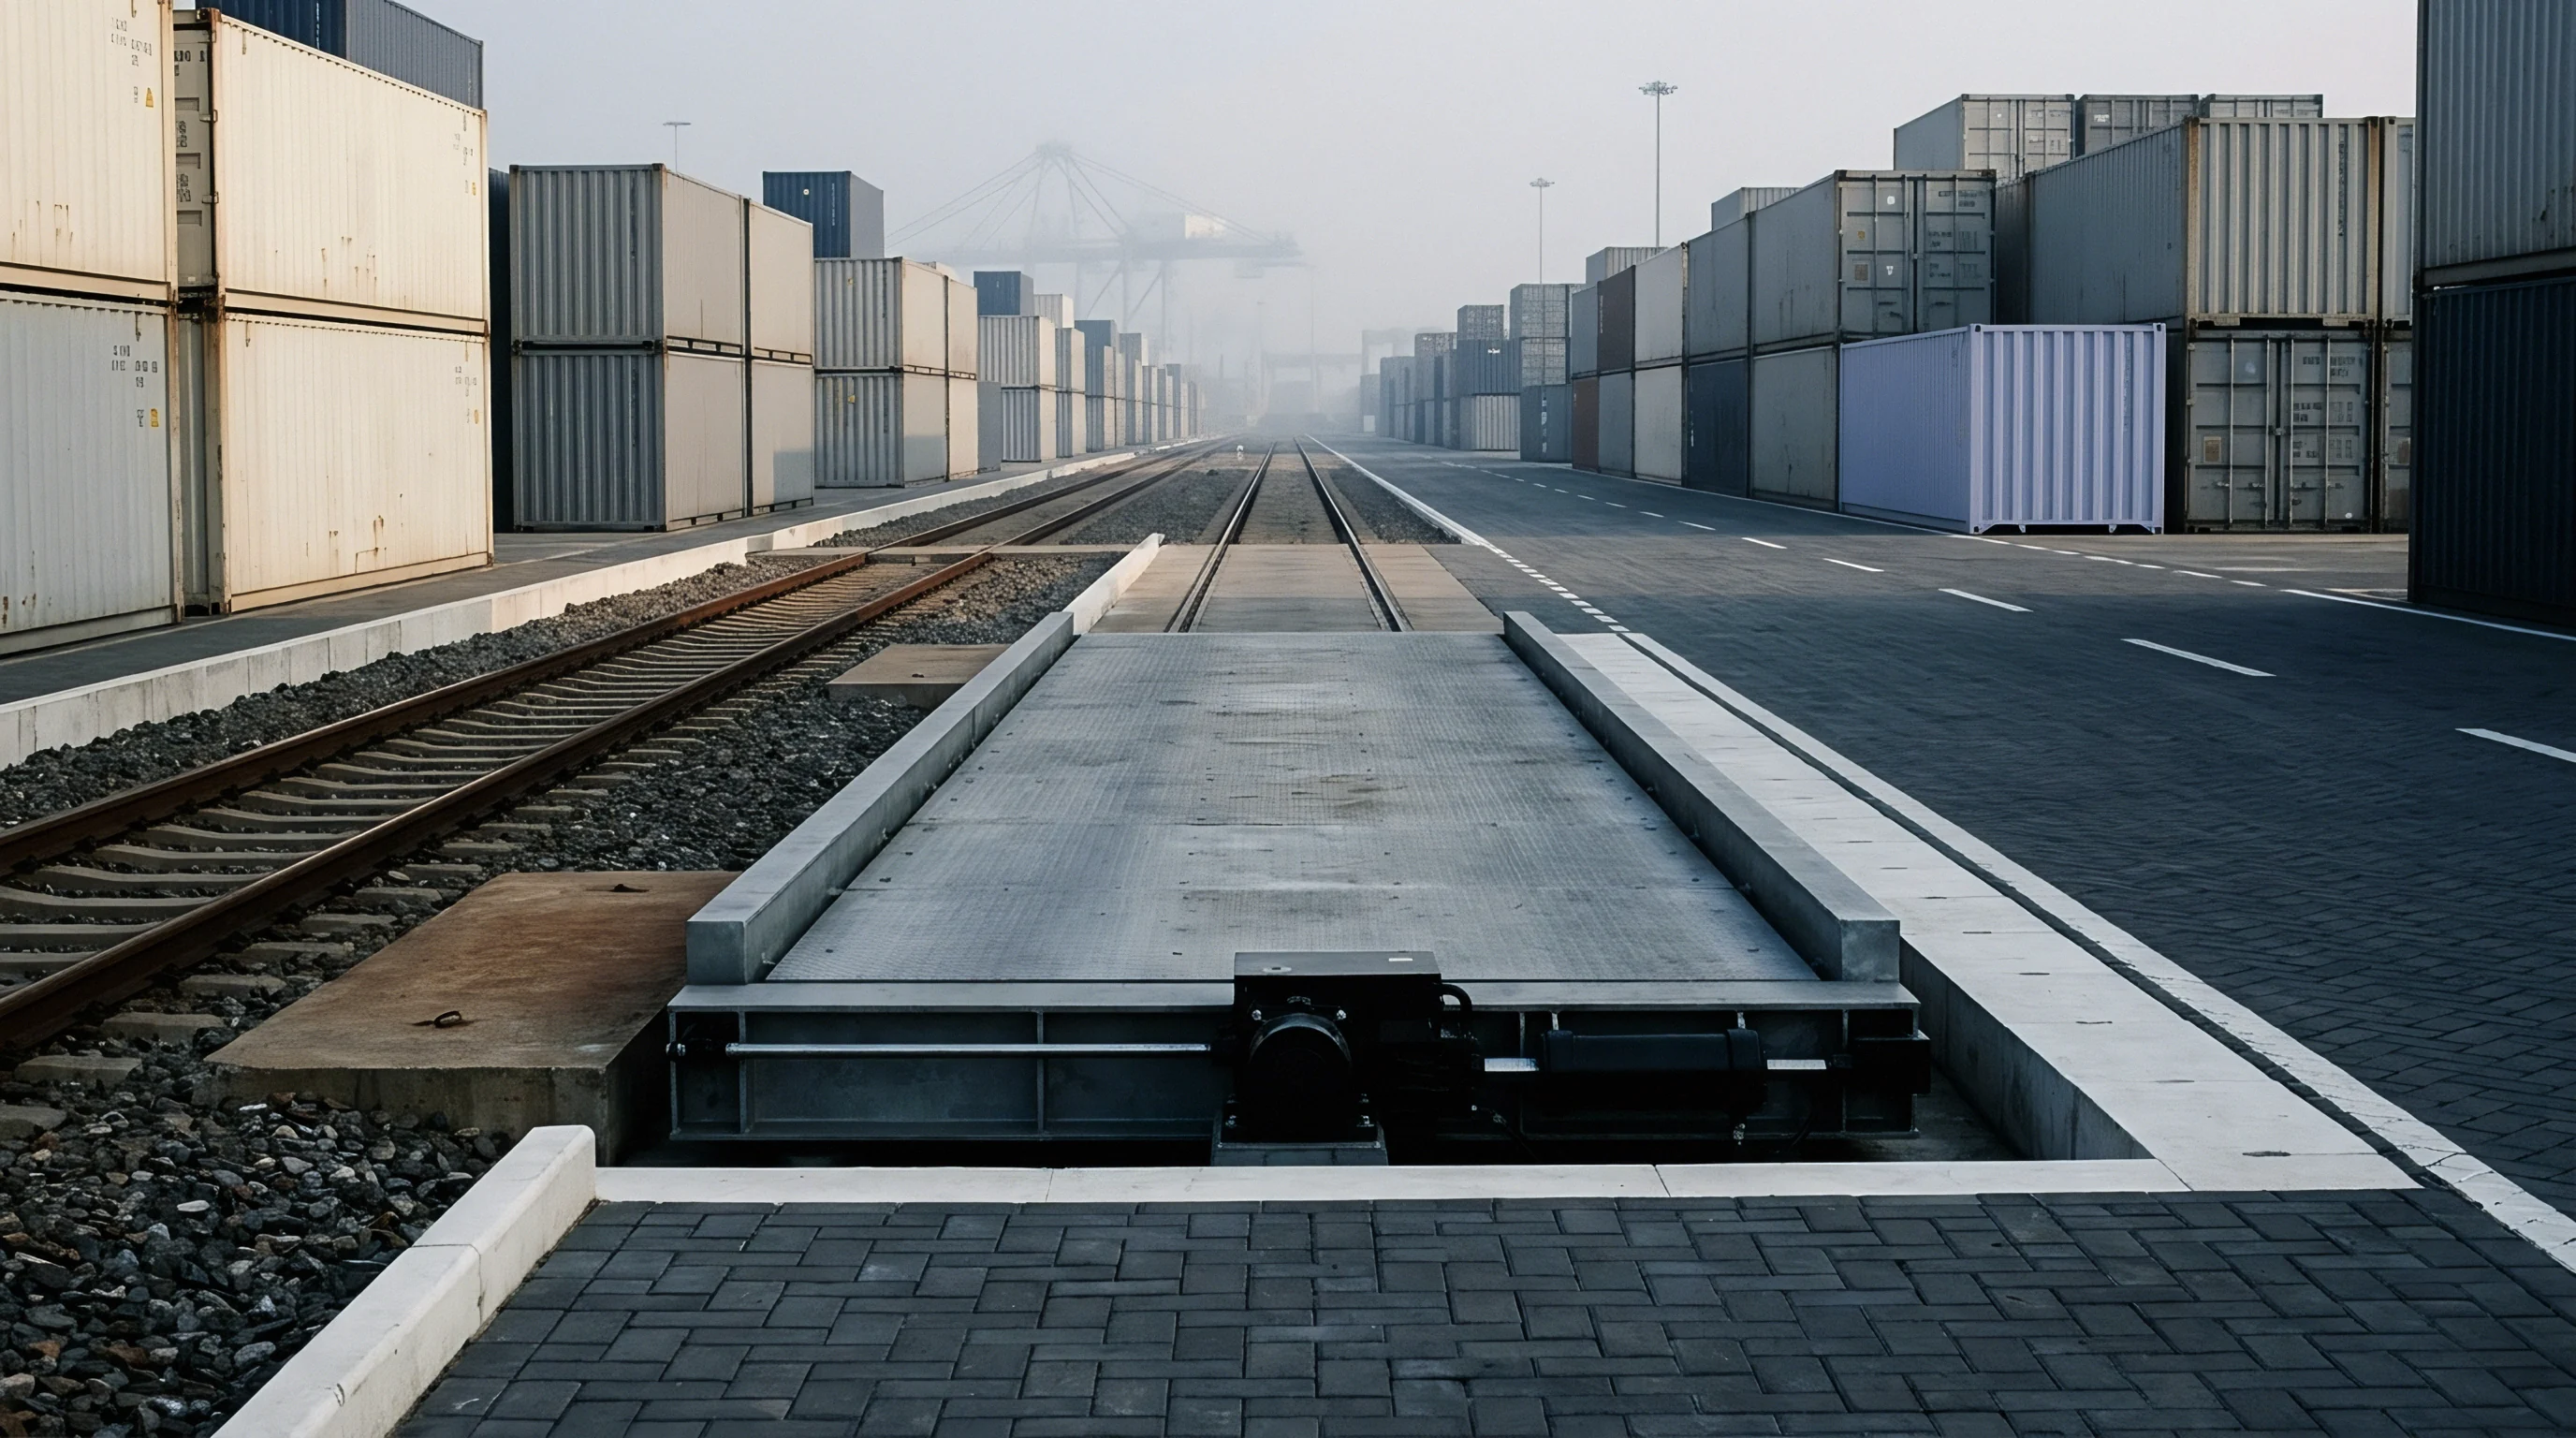
A digital render of an industrial intermodal freight yard containing a central weighbridge flanked by railway tracks and stacked shipping containers.

Outlook

Importers should expect ongoing lead-time volatility as carriers continue managing high terminal utilization with blank sailings. A key indicator to watch is monthly container terminal utilization on major East-West trade routes. If these rates remain above 80%, shippers must hold higher safety stocks to buffer against the extended recovery times that follow routine winter weather or localized labor disruptions.

A tilted blue container rests beside a heavy metallic mooring cleat amid scattered raw material fragments on a dark industrial floor.

Verdict

Shippers must adjust their baseline lead times to account for a permanent loss of port resilience, carrying larger buffer inventories to protect against prolonged recovery cycles.

Signal Acquired from: Splash247

Nomenclature

Maritime Trade Resilience

Systemic Capacity ~ Freight performance measures the ability of a logistics network to sustain scheduled cargo throughput despite external shocks or systemic internal failures.

Vessel Waiting Times

Operational Lag ~ Berth allocation algorithms and terminal scheduling models quantify the duration cargo ships spend anchored offshore or hovering outside a harbor before a berth clears for discharge operations.

Trade Lane Volatility

Rate Fluctuation ~ Shifting freight rate conditions and capacity imbalances across specific maritime shipping corridors create pricing and scheduling unpredictability for international cargo movements.

Port Utilization

Operational Capacity ~ Port utilization measures the ratio between the actual volume of cargo handled during a specific window and the maximum designed throughput volume for that same facility.

Container Throughput

Operational Volume ~ Container throughput measures the total physical movement of twenty-foot equivalent units across terminal quays during a defined reporting interval.

Berth Congestion

Operational Delay ~ Vessel queuing at marine terminals occurs when arrived ships exceed the physical or operational capacity of assigned quays to service them within scheduled window allowances.

Buffer Capacity

System Threshold ~ Resiliency in production and logistics networks measures the maximum volume of unexpected demand or disruption an operational framework absorbs before service levels degrade.

Terminal Capacity

Operational Throughput ~ Throughput potential defines the maximum volume of cargo or passenger traffic a transport hub handles within a fixed period under optimal conditions.

Capacity Management

Volume Control ~ Freight operators adjust available transport space to align operational throughput with prevailing cargo volumes.

Transit Lead Times

Logistics Interval ~ Cargo transit lead times denote the cumulative duration measured from the departure of a carrier at the point of origin until the arrival at the final destination facility.

Maritime Economics

Market Allocation ~ Commercial shipping analysis examines maritime economics through the continuous balancing of global trade demand against available vessel capacity.

Ocean Freight Planning

Capacity Scheduling ~ Maritime transport logistics involves the coordination of vessel space and container throughput to maintain a steady flow of goods.

What the firm knows, published

Expertise is a utility, not a secret. sentiention™ publishes its working knowledge as open reference: intelligence layer covering the materials it sources, the markets it enters, and the reference that serves both.