Surge in Global Port Congestion Restricts Container Capacity for Buyers

Rising port congestion locks up vessel capacity as terminals prioritize cost over resilience, driving transit delays higher.
28.08.26 2 min

Briefing

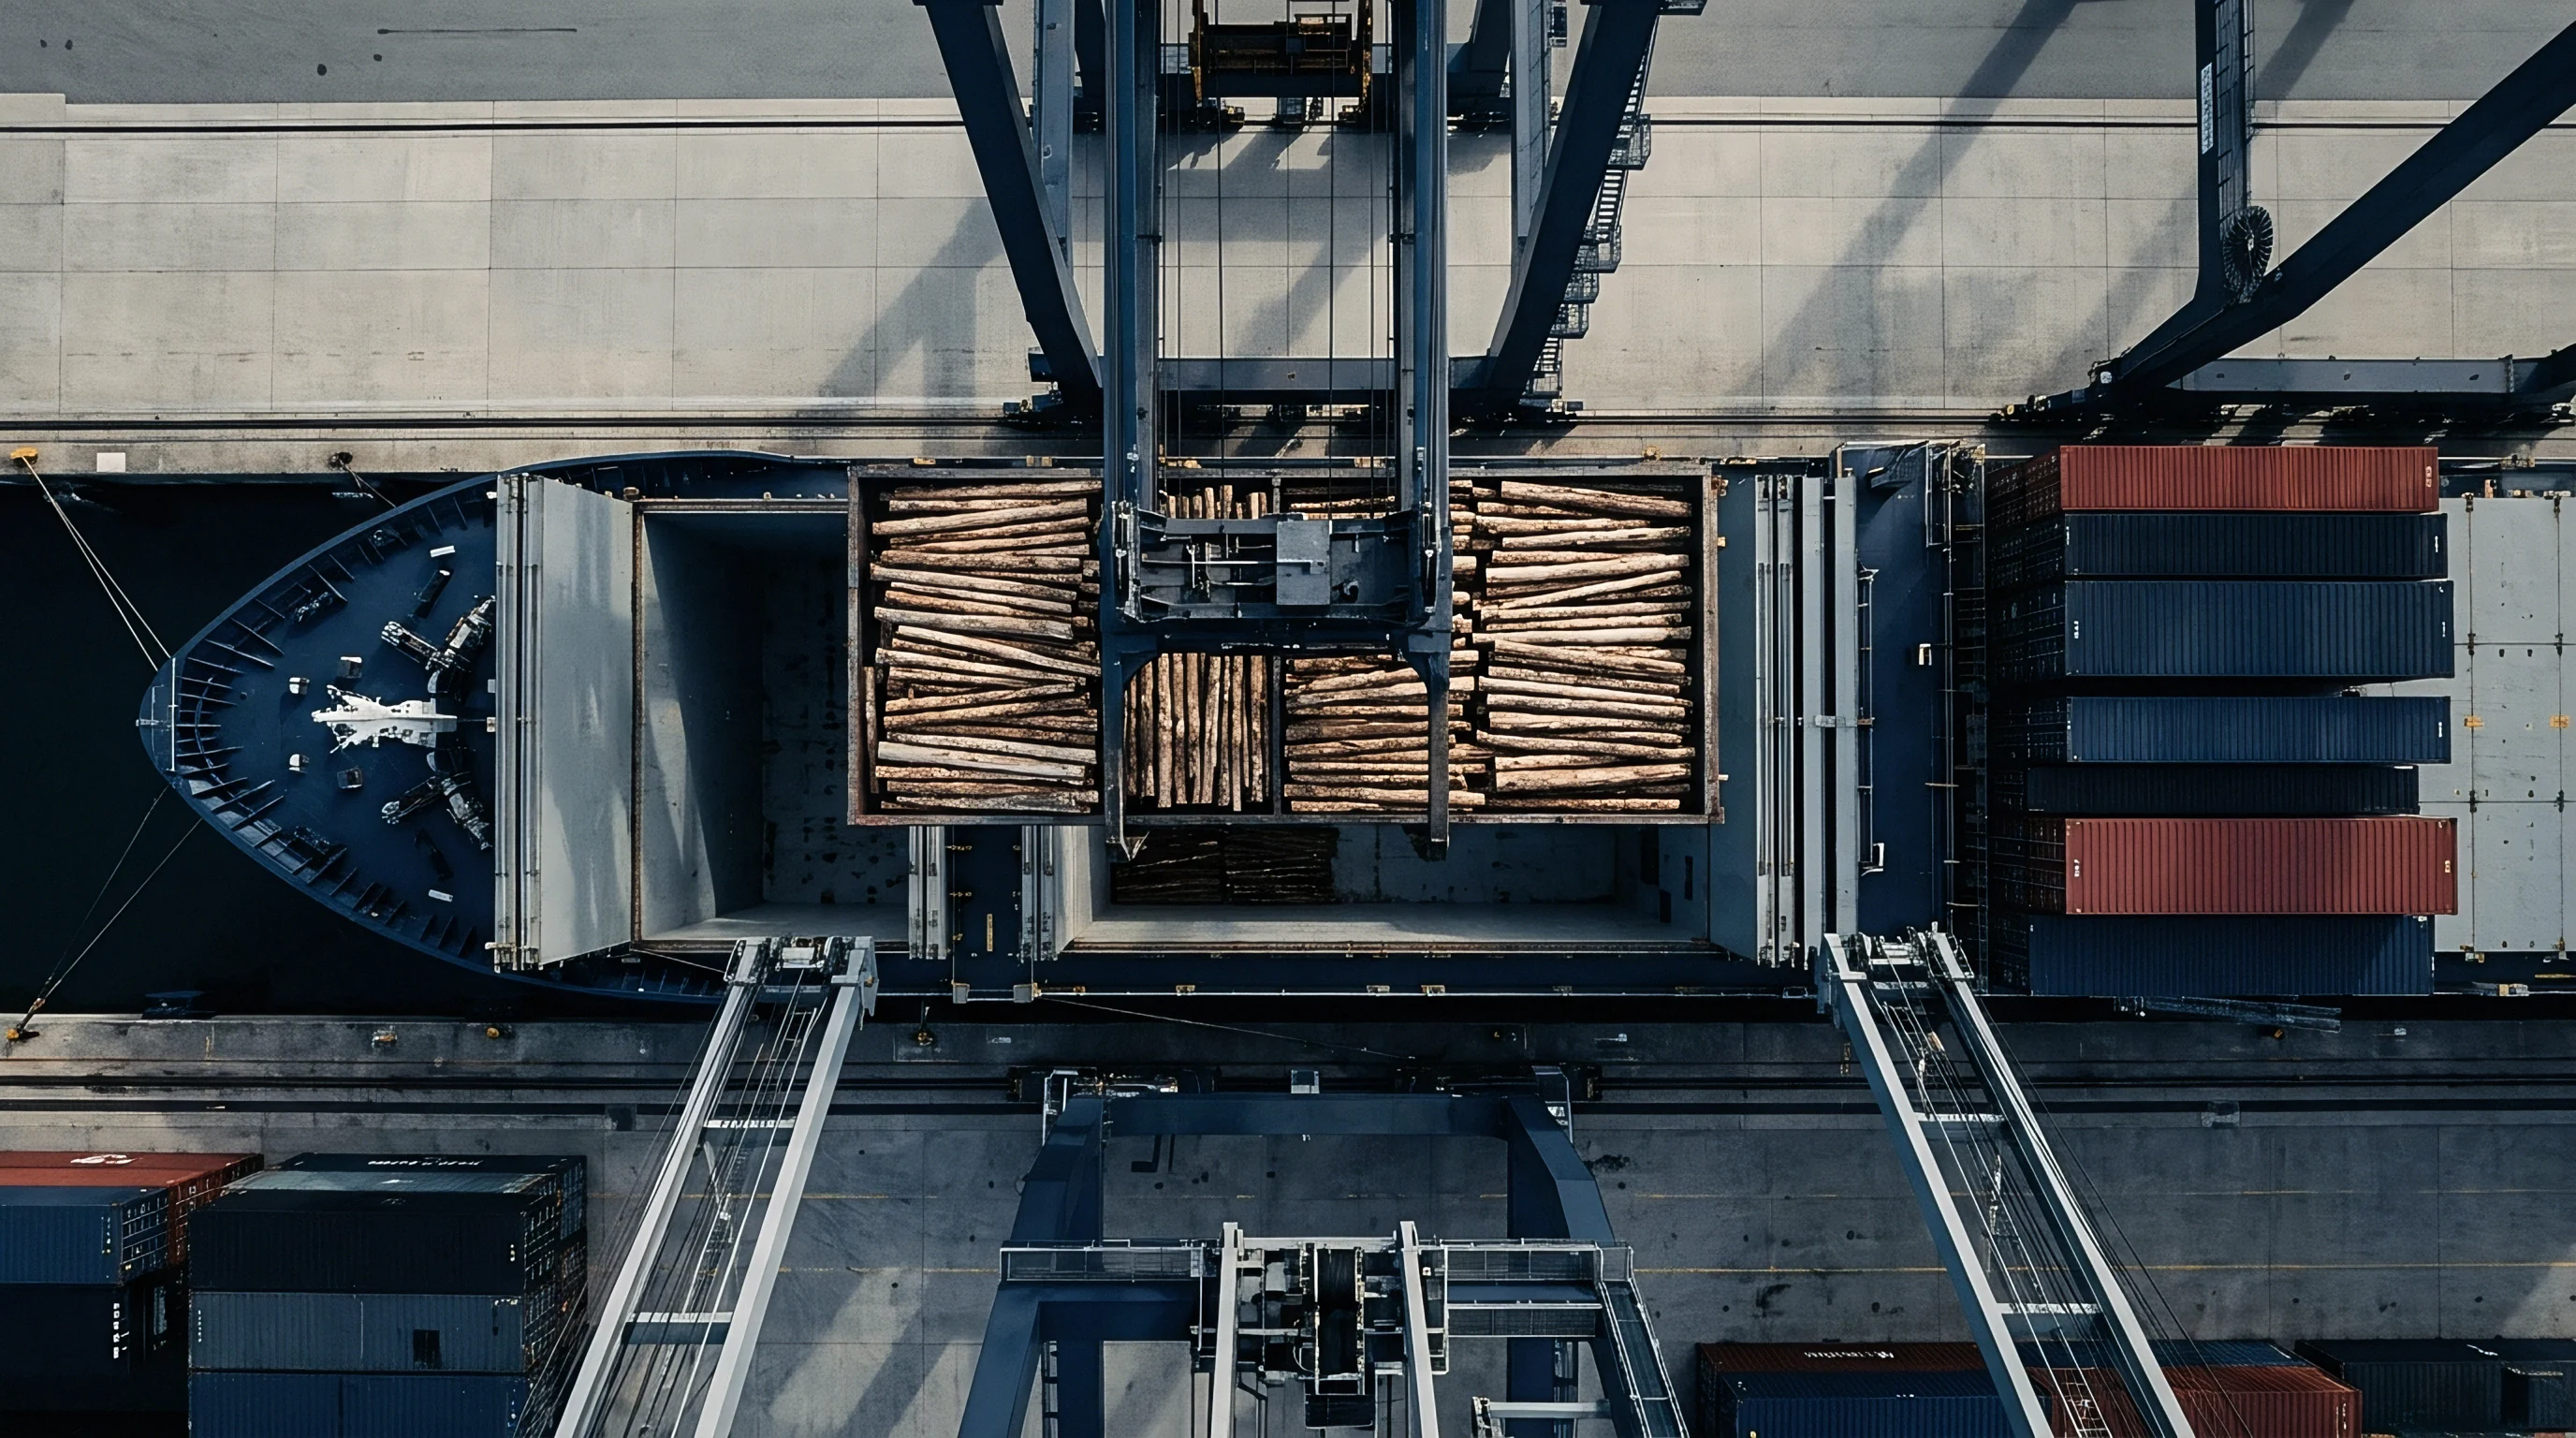
Global port congestion is worsening sharply, according to Drewry, tying up ocean supply chains and stalling inbound freight. For procurement teams, this bottleneck means longer lead times, scarce equipment, and erratic transit schedules while key hubs process vessel backlogs. Terminals are running near capacity, leaving little room to absorb shocks from Cape diversions, bad weather, or blank sailings. Across the globe, roughly 4.3 million TEU of containership capacity is currently stuck waiting at anchor.
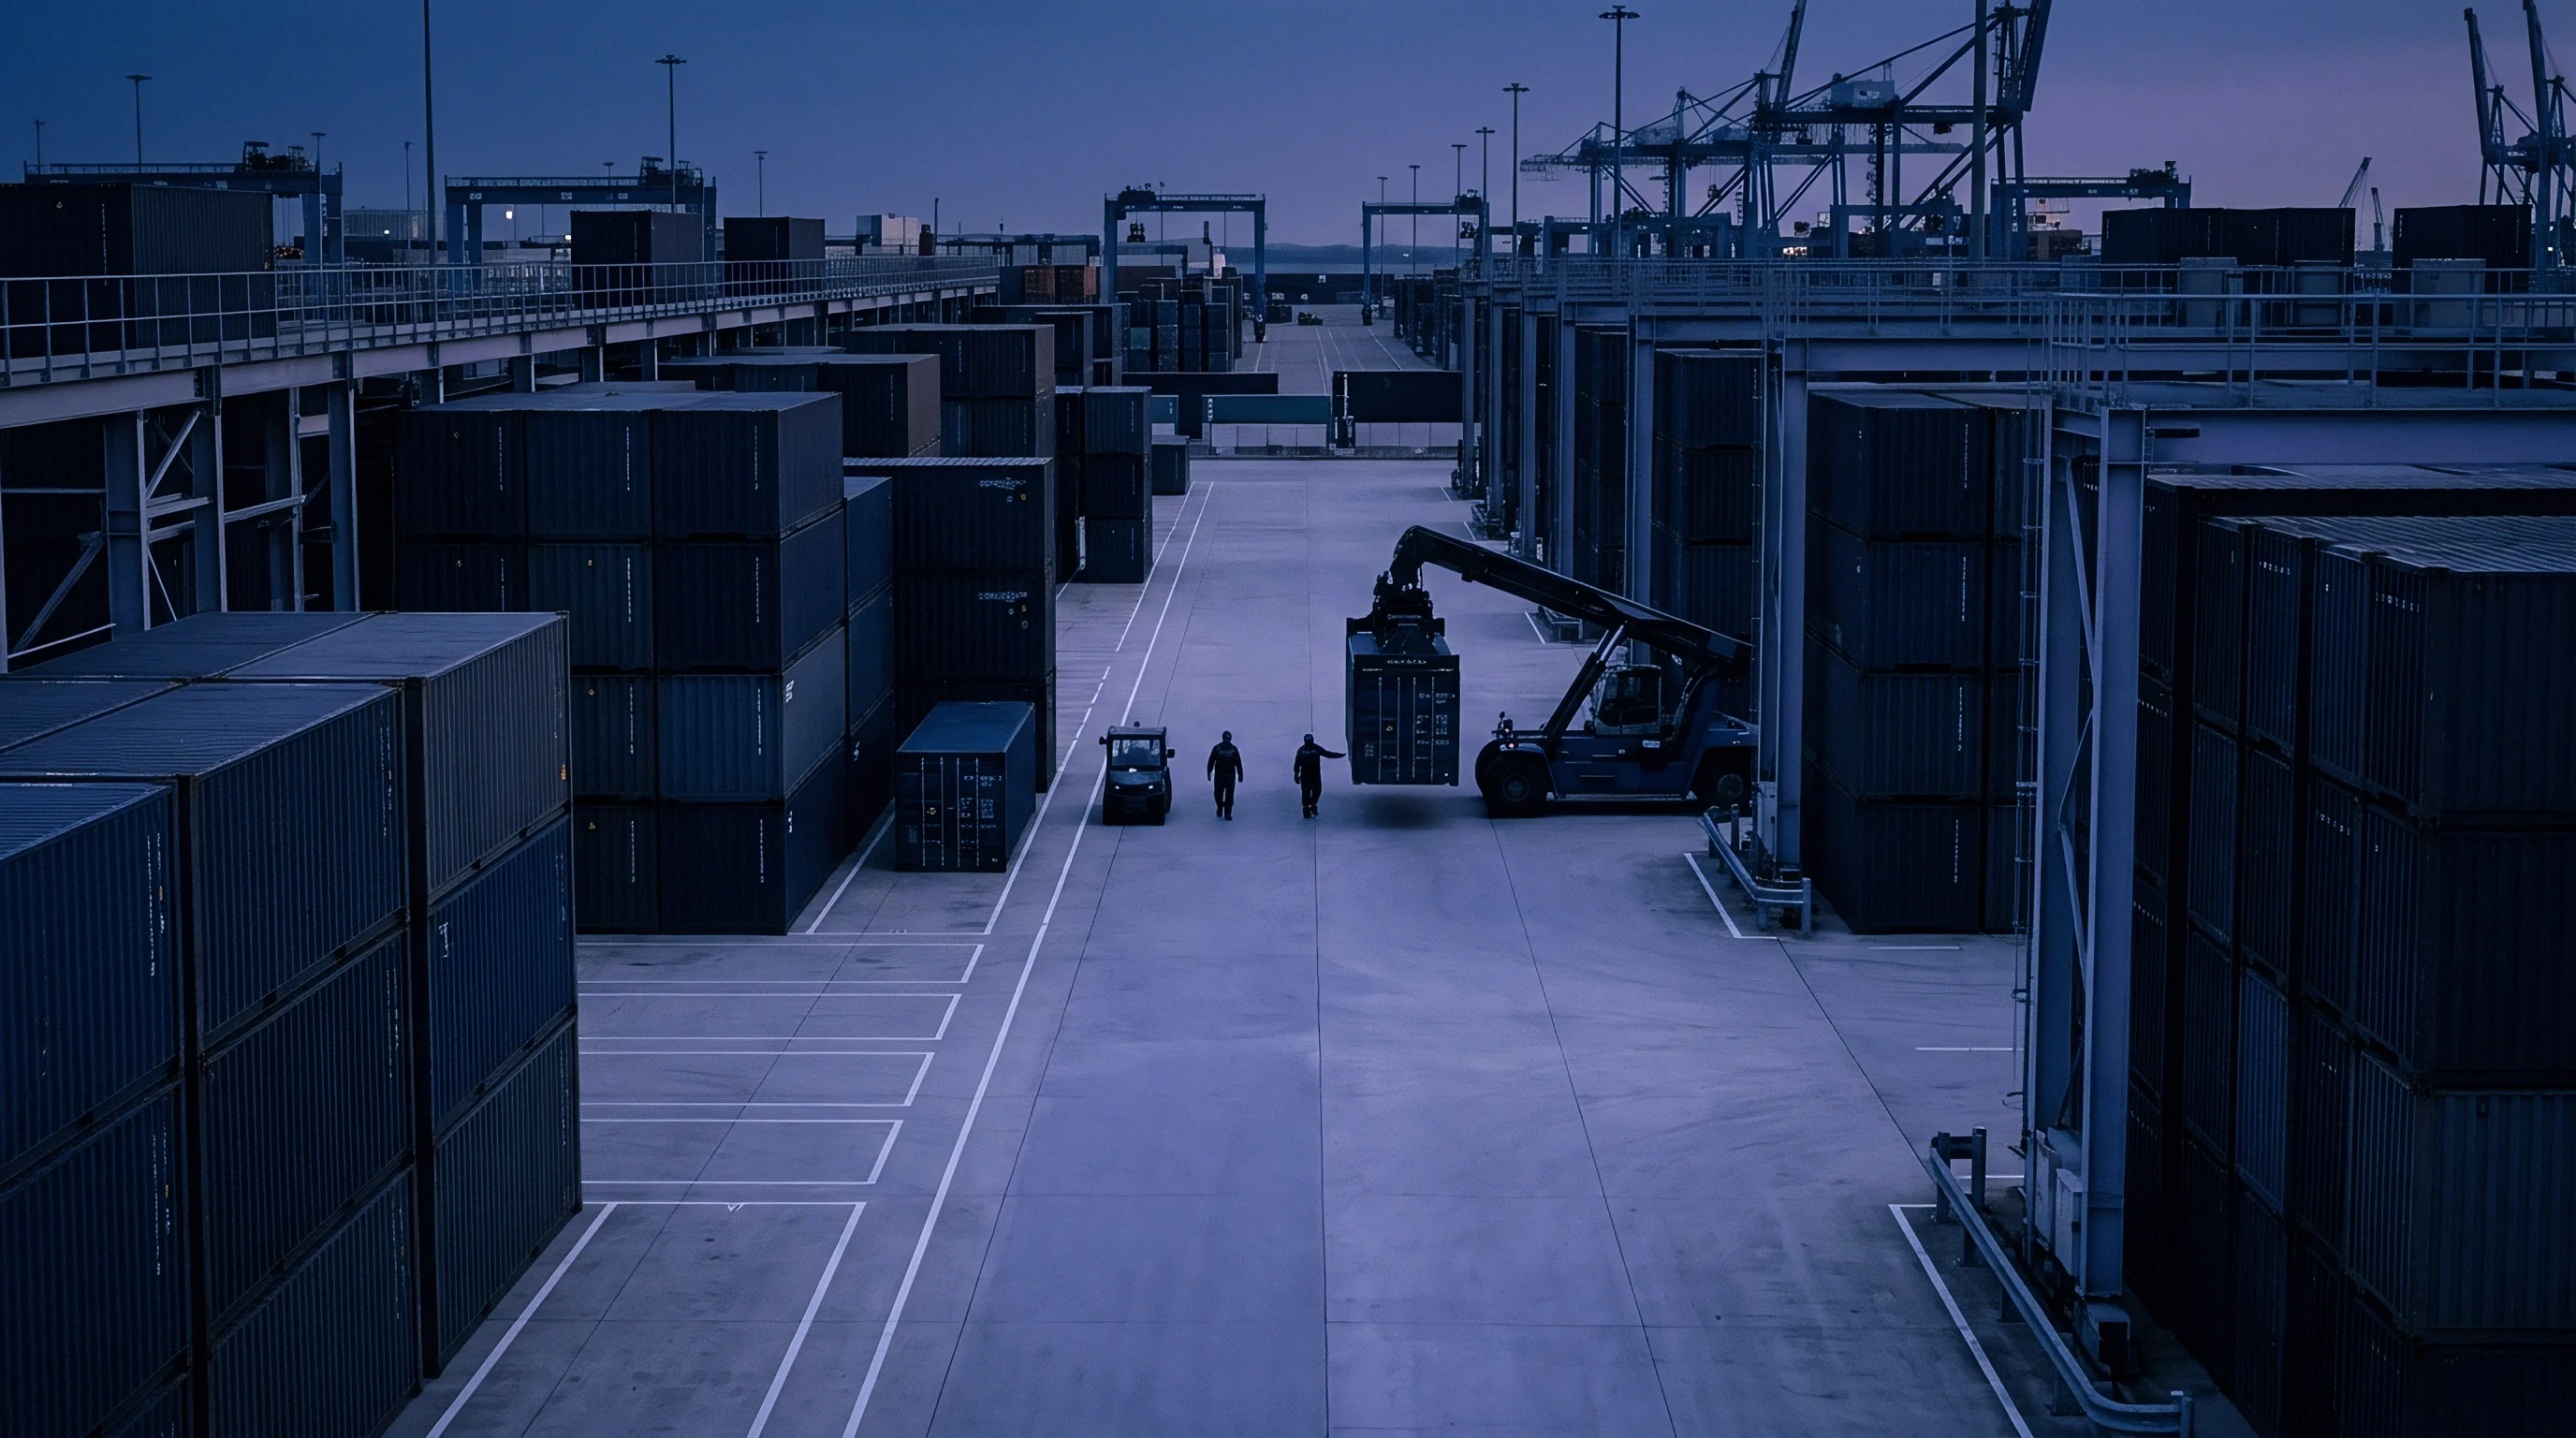
Intermodal shipping containers fill the illuminated freight terminal yard as a heavy reach stacker positions cargo between structural bays.

Context

Shippers had counted on an influx of newbuild vessels to soften container rates and free up capacity. Procurement desks tracked more than 7 million TEU of incoming fleet additions, expecting that wave of tonnage to offset Cape of Good Hope reroutings and pull transport costs back down. It was largely taken for granted that fleet expansion would eventually bring relief.
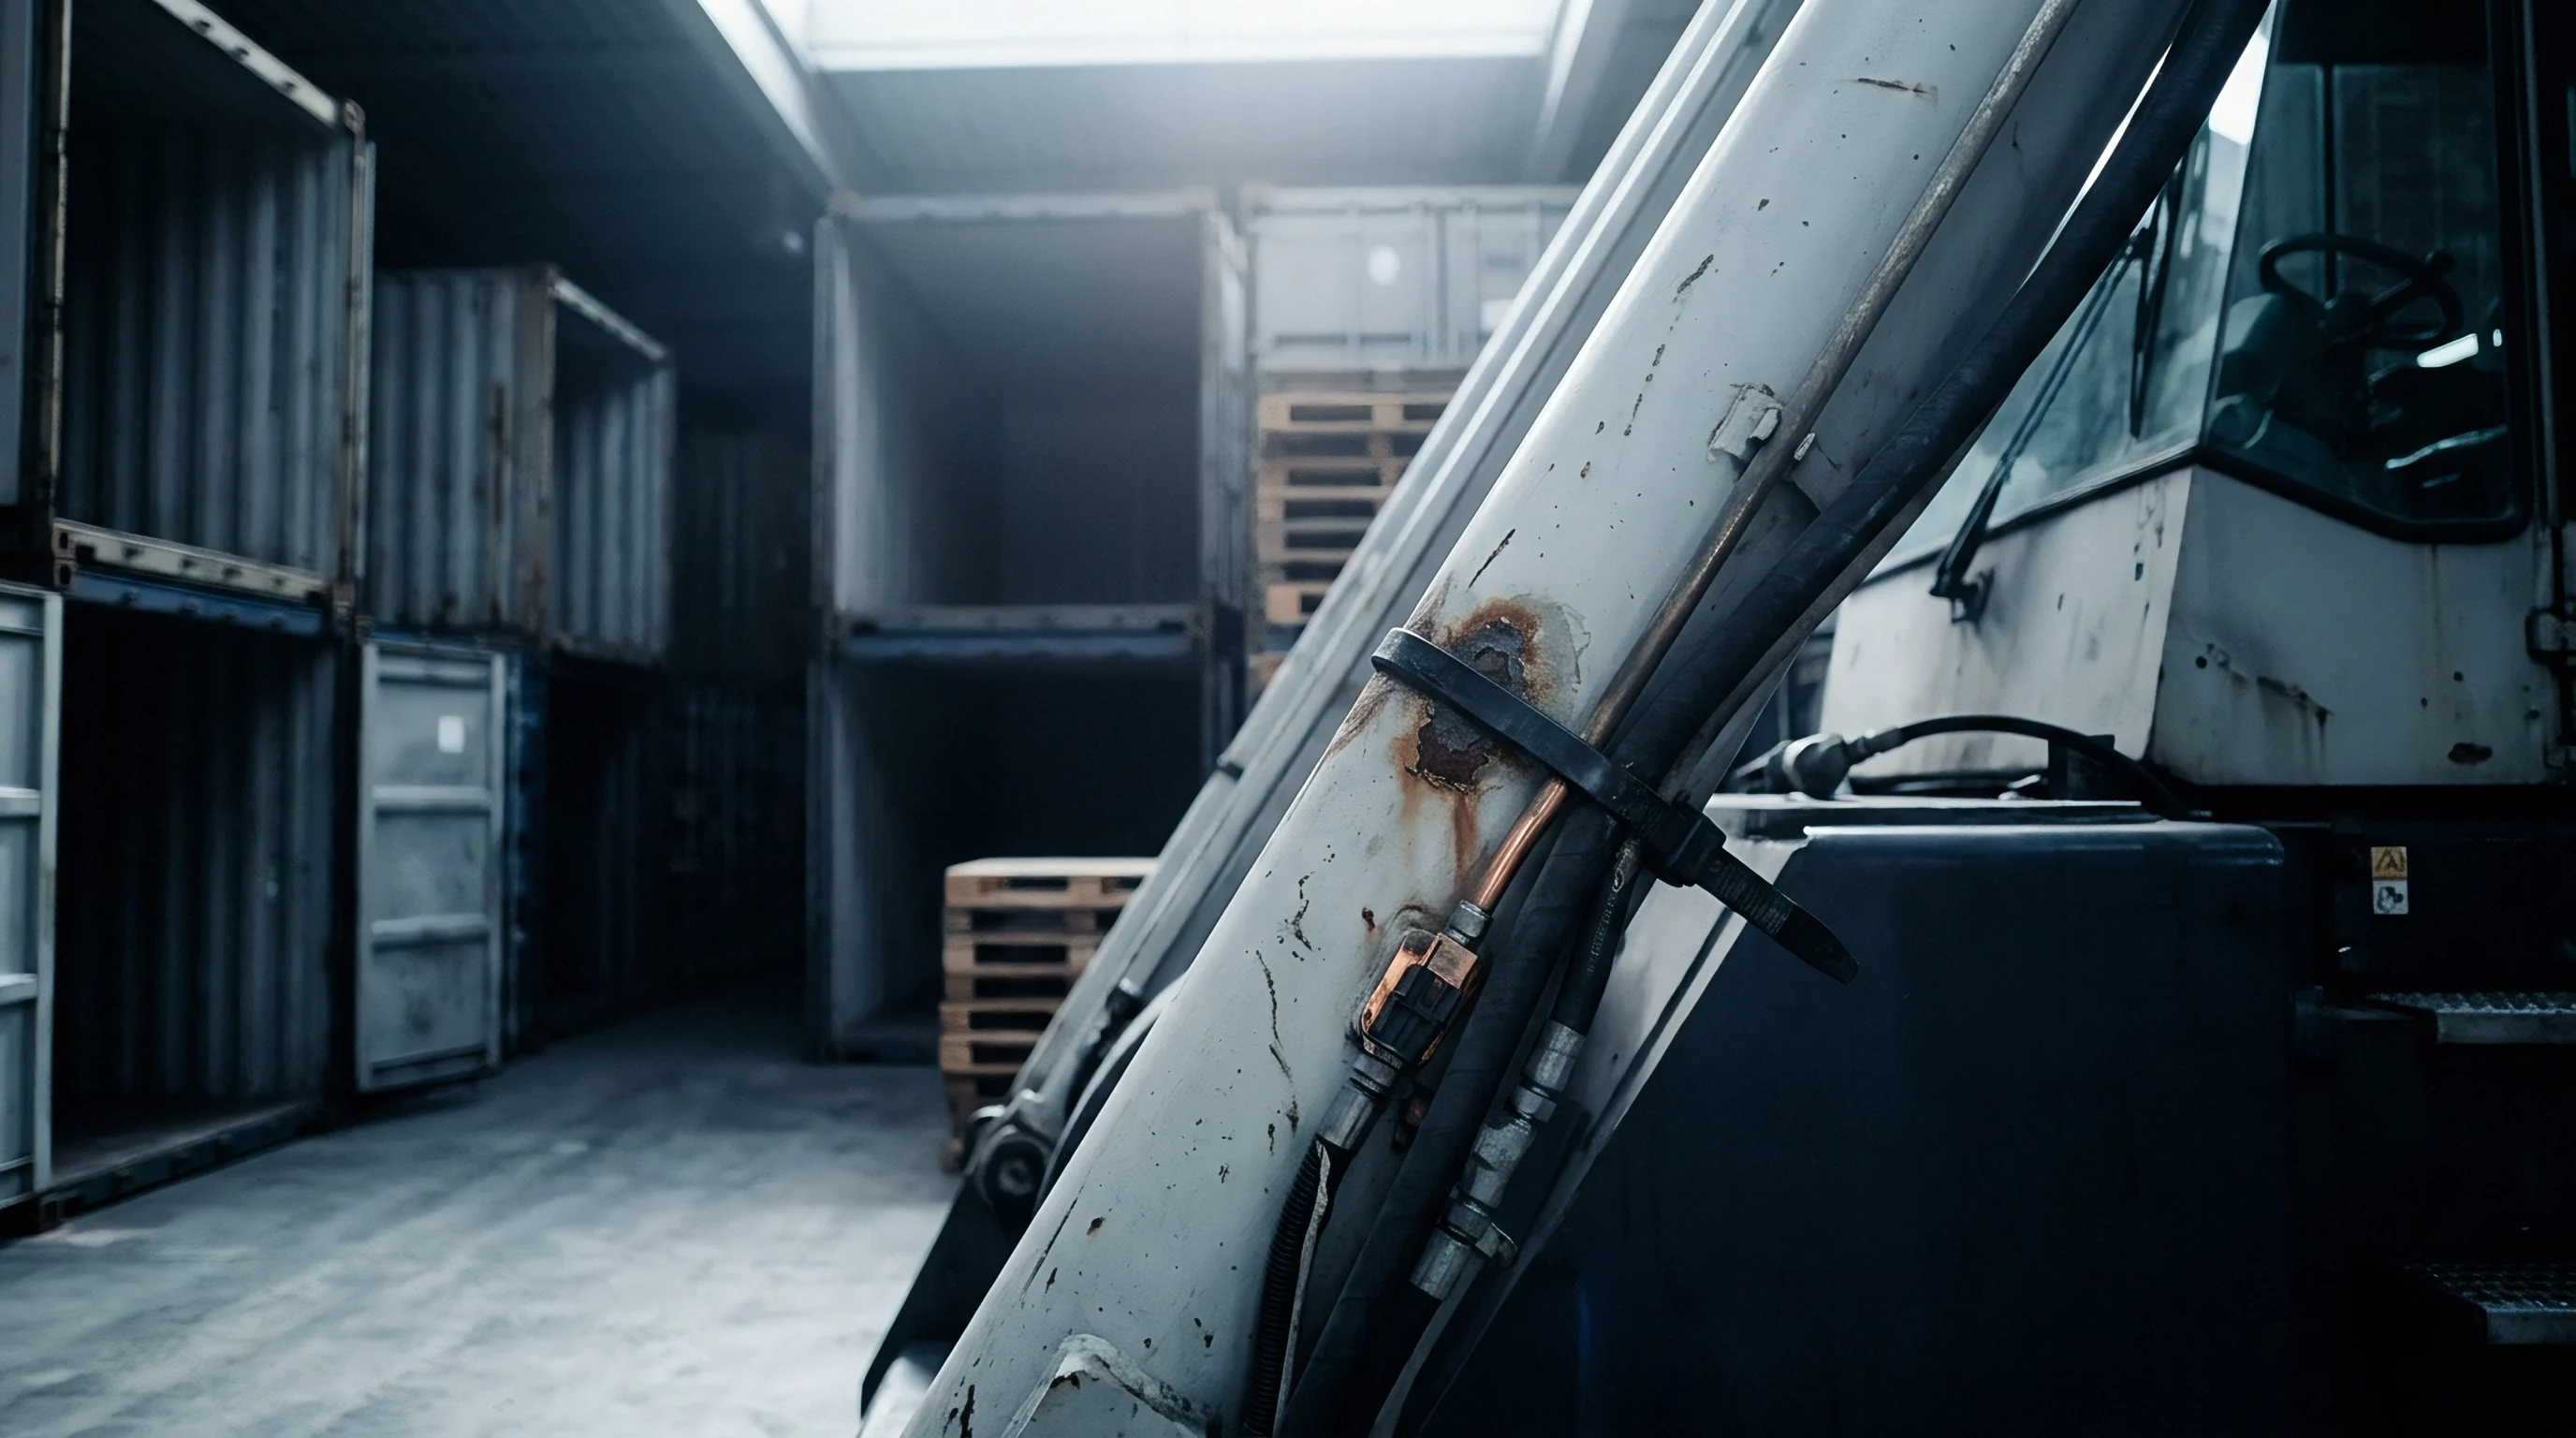
Rusted hydraulic lift arm components on industrial cargo handling machinery stand inside a metal shipping container storage depot.

Analysis

The root problem is structural: terminal capacity has failed to keep pace with throughput. Over the past seven years, cargo volumes across nine major ports climbed 28 percent against capacity expansion of just 21 percent. To maximize financial returns, operators have pushed berth utilization past 90 percent, stripping out the operational buffer needed to handle disruptions. When bad weather or route adjustments knock vessels off schedule, ships arrive in bunches ~ a dynamic known as burst congestion. A facility running at 90 percent utilization needs roughly seven days to recover from a single day of schedule disruption, much like a single-runway airport where one delayed flight cascades into days of ground delays. For cargo owners, this bottleneck has driven a 31 percent increase in time spent in port, dragging out the full run from factory to warehouse.
A hand secures a small hardware tracking unit to a structured surface near container cranes and a cargo ship in port.

Parameters

  • Global Idle Capacity ~ 4.3 million TEU of containership capacity is currently waiting to berth worldwide.
  • Port Time Increase ~ 31 percent increase in the average time vessels spend in port compared to 2019 levels.
  • Durban Port Delay ~ Vessel waiting times ranging from 8 to 12 days, with some carriers warning of 20-day delays.
  • Berth Utilization Recovery Time ~ 7 days required for a terminal at 90 percent utilization to recover from a single day of delay.
Heavy cylindrical cargo rests on a concrete port terminal visible through the illuminated control console of a maritime facility.

Outlook

Gridlock will continue eating into effective vessel space, keeping spot freight rates elevated through the autumn shipping peak. Buyers should closely monitor the weekly Drewry Intra-Asia Container Index alongside queue times at Shanghai and Ningbo. If wait times in Shanghai hold above the current 96-hour threshold, carriers will likely step up blank sailings, forcing shippers to pay premium surcharges to secure equipment and space for year-end freight.
Metal extraction machinery processes a heavy cylindrical billet above stacked shipping containers inside a dim industrial freight terminal at evening.

Verdict

Secure container bookings at least six weeks in advance to bypass worsening port delays.

Signal Acquired from: Splash247

Nomenclature

Port Congestion

Systemic Bottleneck ~ Marine transit interruption occurs when vessel arrival volume exceeds the capacity of terminal infrastructure to process cargo, leading to extended wait times at anchorage or within berths.

Container Shipping

Freight Methodology ~ Standardized modular transport utilizes intermodal metal units to move goods across global trade routes.

Transit Delays

Schedule Variance ~ Deviations between planned transportation timetables and actual shipment arrival times measure operational friction across international freight networks and domestic distribution corridors.

Berth Utilization

Docking Capacity ~ A quantitative ratio of occupied quay hours against total available operational time provides a baseline for evaluating port infrastructure density.

Supply Chain Resilience

Operational Continuity ~ Logistics infrastructure stability defines the capacity of international freight systems to maintain movement despite sudden external shocks or system failures.

Demurrage Charges

Container Penalty ~ Monetary assessments accrue when cargo units exceed the allotted time permitted for loading or unloading activities at a terminal or port facility.

Ocean Logistics

Marine Transit ~ Global trade movement relies on the systematic coordination of cargo across international waters to maintain supply chain continuity.

Marine Terminals

Transfer Interface ~ Port infrastructure facilities house specialized berth infrastructure, gantry cranes, storage yards and intermodal rail connections designed to transfer containerized, liquid bulk or dry bulk cargo between ocean vessels and land-based transport networks.

Vessel Capacity

Fleet Metric ~ The total physical volume and weight of cargo that a merchant ship can legally and safely carry is measured in twenty-foot equivalent units or deadweight tonnage.

Blank Sailings

Service Withdrawal ~ The intentional cancellation of scheduled ocean transport services allows carriers to manage vessel capacity and stabilize freight rates during periods of low demand.

What the firm knows, published

Expertise is a utility, not a secret. sentiention™ publishes its working knowledge as open reference: intelligence layer covering the materials it sources, the markets it enters, and the reference that serves both.