Record Vessel Delays Absorb Five Percent of Global Container Fleet Capacity

Systemic vessel delays remove 1.7 million TEU from active trade, effectively shrinking global ocean capacity for buyers.
29.08.26 2 min

Briefing

Operational bottlenecks have stranded a record 4.31 million TEU in port queues, pulling 5 percent of the global deep-sea fleet out of active trade. Schedule reliability sits at 62 percent, stretching transit cycles as late arrivals average delays of 5.3 days. This tied-up space ~ some 1.7 million TEU sitting idle at sea ~ creates an artificial capacity squeeze that continues to underpin spot rates. Fleet capacity absorption has risen from a historical norm of 2 percent up to 5 percent.

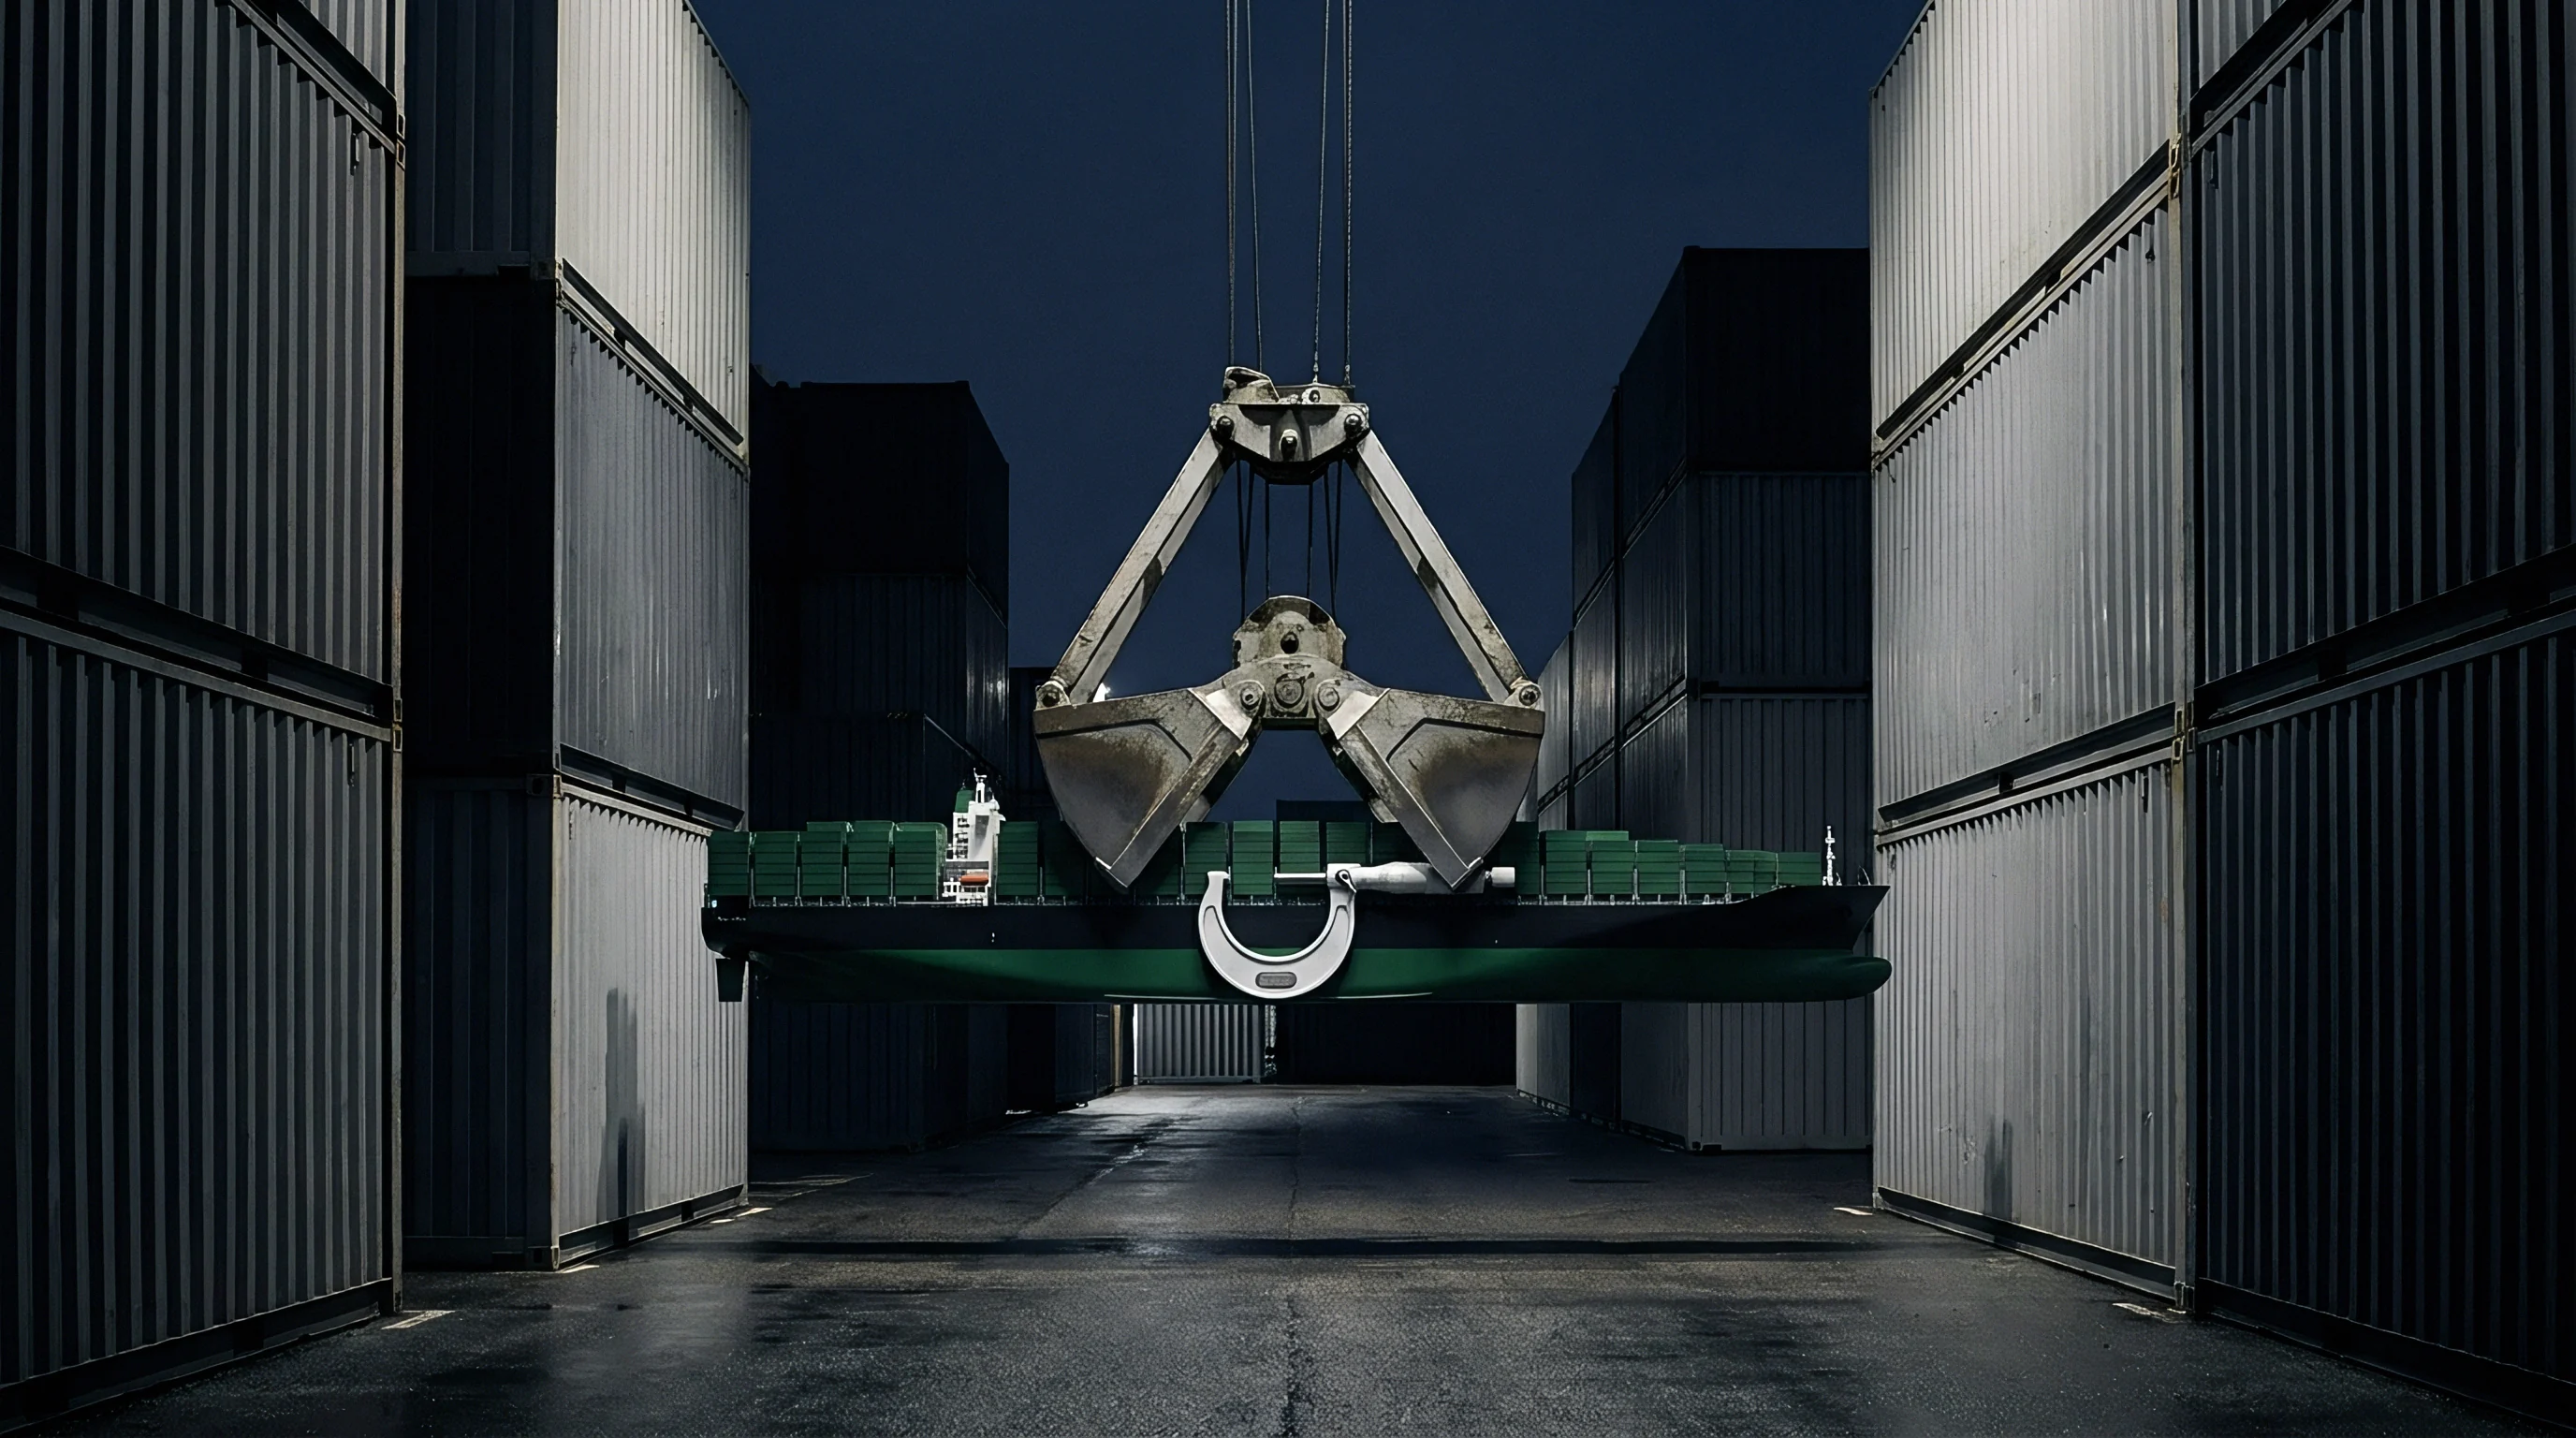
A dark digital render features a miniature cargo vessel suspended above a reclining figure beside a podium against a dark background.

Context

Procurement teams have been tracking terminal productivity after a series of weather disruptions hit Asian export hubs. Cargo owners generally assumed schedule reliability would recover once seasonal typhoons passed, with buyers questioning whether recent fleet investments would finally translate into predictable rotations and ease freight spending.

Rusted hydraulic lift arm components on industrial cargo handling machinery stand inside a metal shipping container storage depot.

Analysis

Port delays act much like a clogged warehouse bay. When a container ship sits at anchor rather than at berth, its capacity is locked out of the market. That operational friction directly shrinks the usable global fleet. With a significant slice of overall capacity tied up at any given moment, carriers resort to blank sailings to get schedules back on track. As logistics managers bid for what little active space remains, spot rates face steady upward pressure. Meanwhile, out-of-sequence arrivals push lead times longer as terminals scramble to shift labor away from planned export loadings.

A polished steel industrial pressure vessel featuring a heavy manual control valve sits staged within an active construction facility yard.

Parameters

  • Capacity Absorption ~ 5 percent of the global container fleet currently missing from active trade.
  • Stranded Volume ~ 4.31 million TEU at anchor according to latest market analytics.
  • Average Arrival Delay ~ 5.31 days for late vessels across primary deep-sea lanes.
  • Global Schedule Reliability ~ 62.6 percent of arrivals fall within their scheduled window.
  • Far East to US East Coast Spot ~ USD 10,527 per FEU average as of late August.

Worker hands grip padded guide ropes of a vertical marine boarding ladder mounted to a dark vessel hull.

Outlook

Schedule reliability is set to stay depressed while major hub ports in East China clear lingering backlogs. Weekly terminal utilization metrics for Shanghai and Ningbo will be critical to track through September. High occupancy across these gateways points to congestion lasting into the fourth quarter, keeping cargo rollovers high and schedules erratic heading into the autumn shipping season.
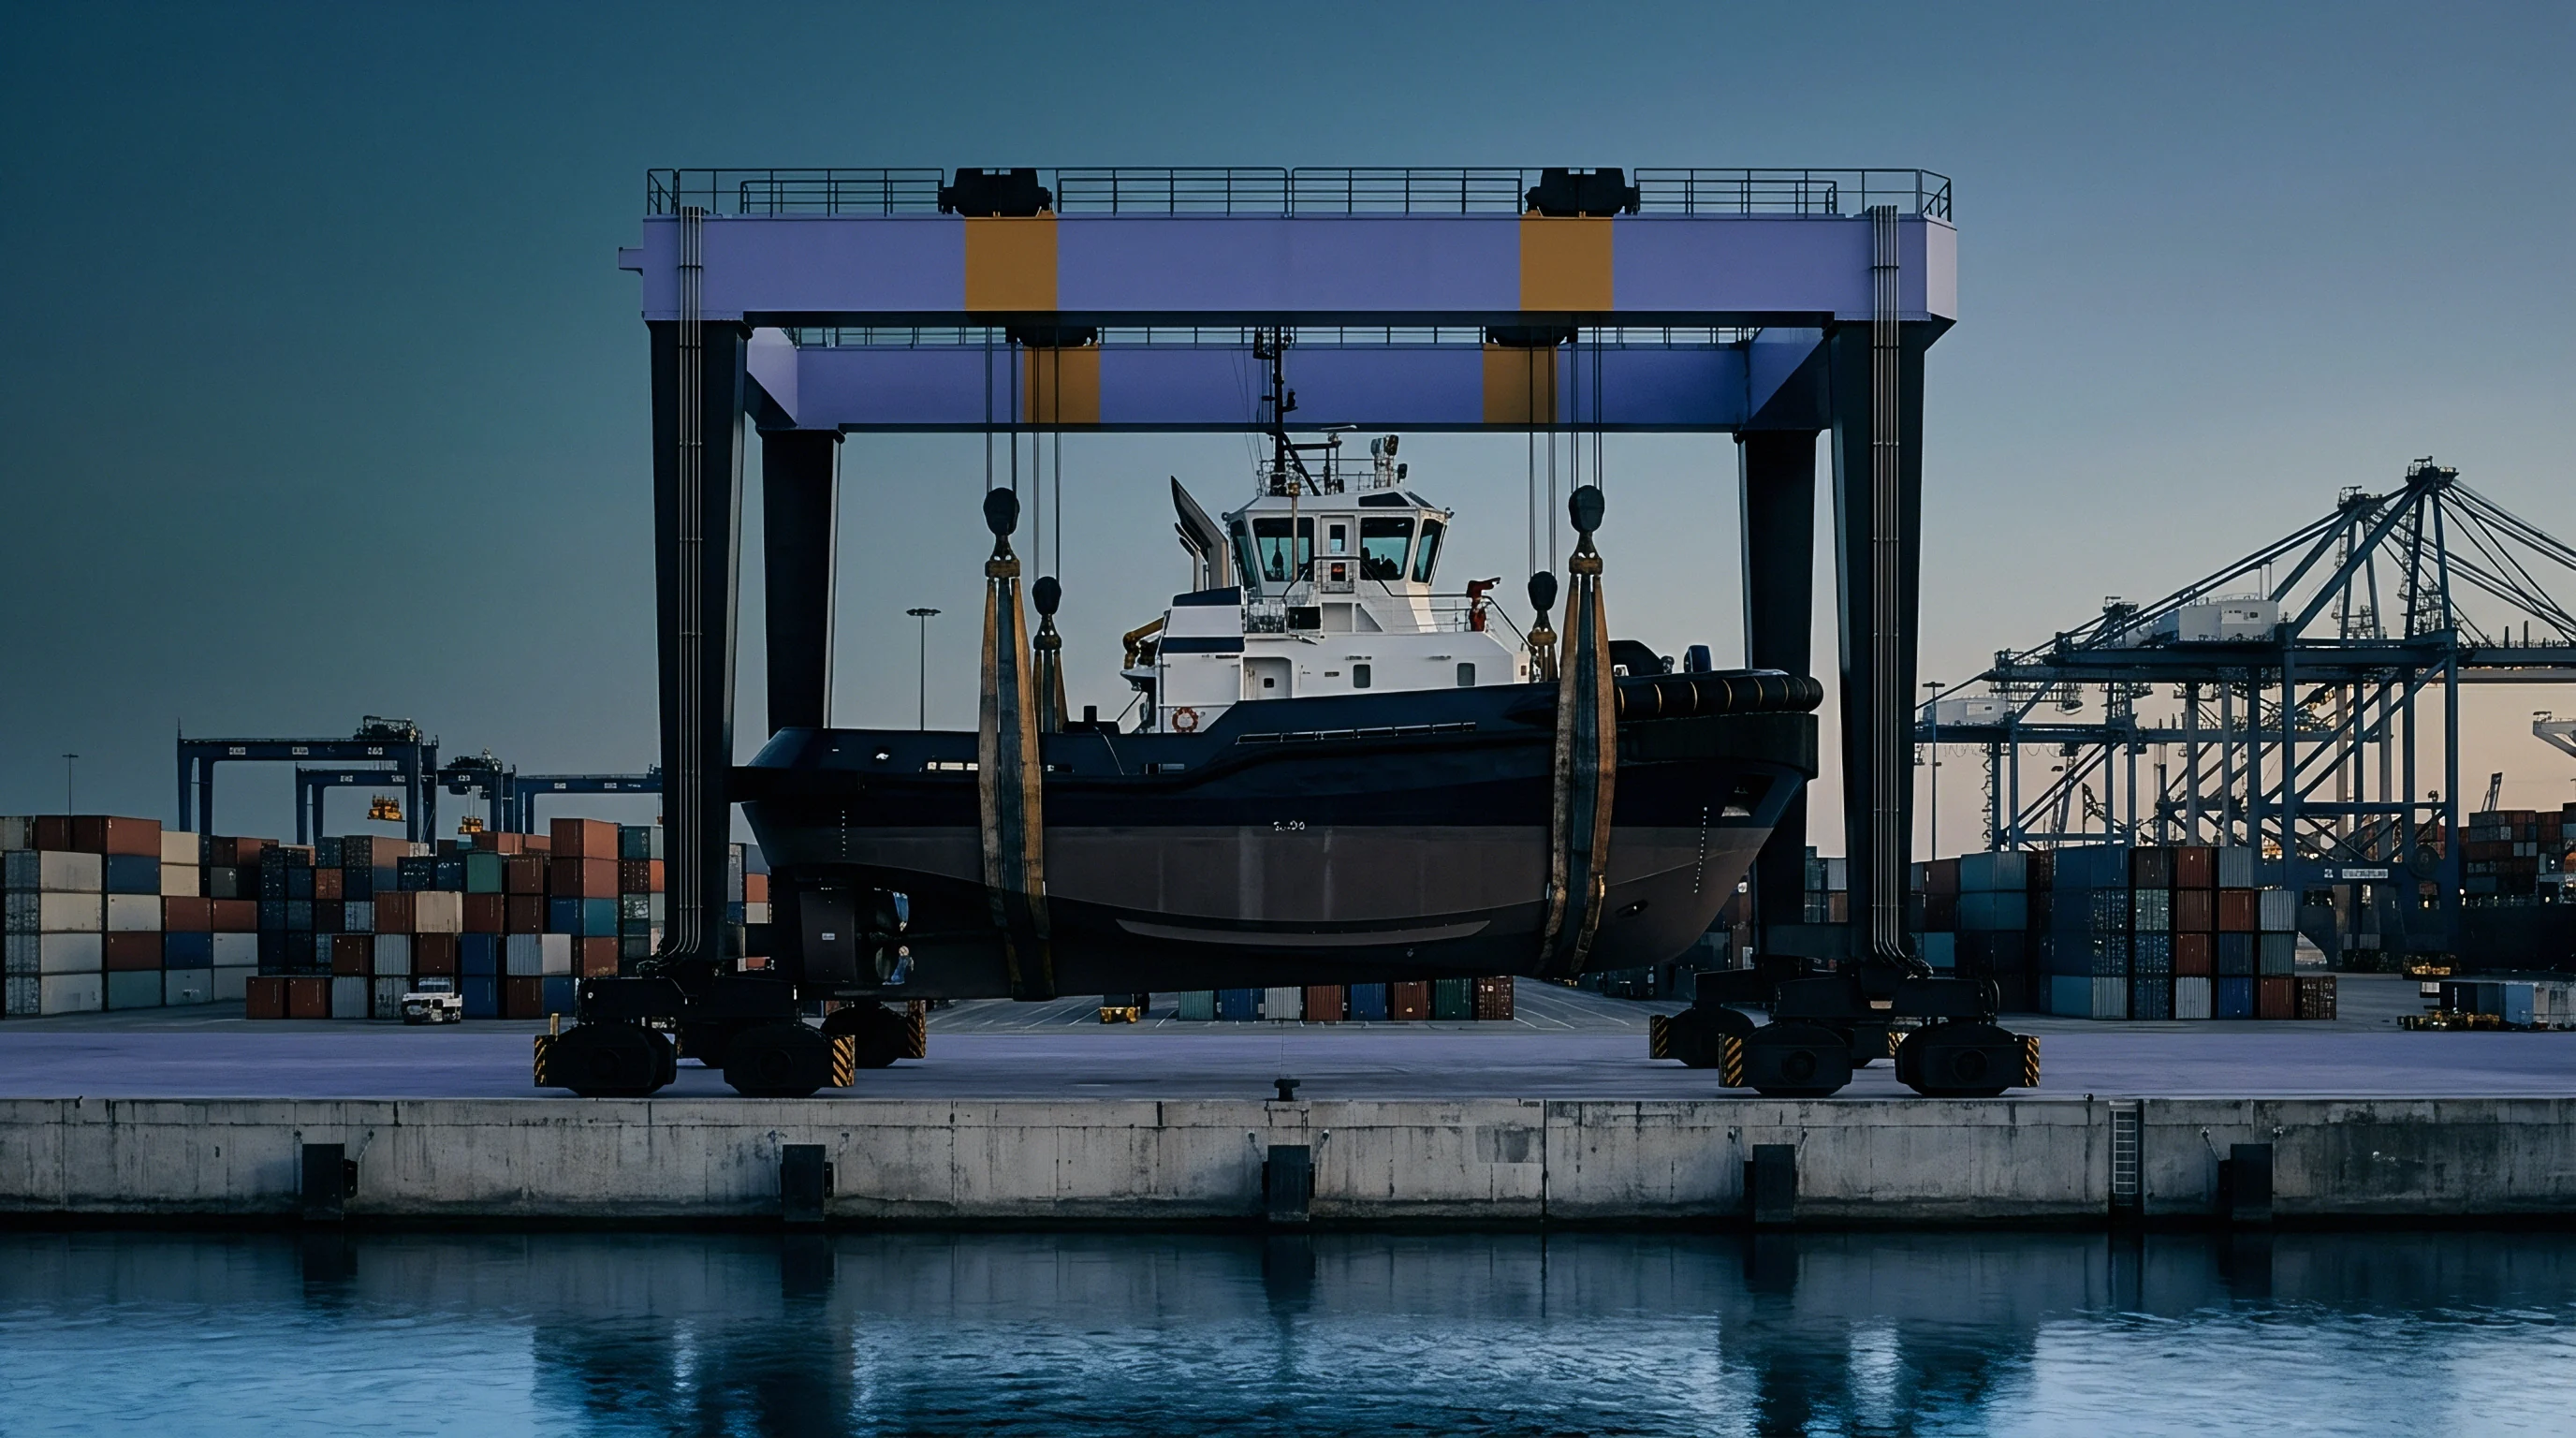
A heavy gantry crane suspends a painted steel tugboat above a concrete terminal surrounded by shipping containers at dusk.

Verdict

Logistics planning needs to account for an effective active fleet smaller than its nominal capacity, as elevated port delays continue to absorb operational supply.

Signal Acquired from: The Maritime Executive

Nomenclature

Capacity Absorption

Utilization Rate ~ Allocation of active vessel space to freight demand measures the efficiency of a maritime fleet.

Harbor Bottlenecks

Congestion Mechanism ~ Systemic delays occurring at major maritime gateways prevent the efficient movement of ocean freight and disrupt global distribution schedules.

Maritime Operations

Shipment Governance ~ Coordination of deep sea transit and port terminal handling defines maritime operations as a complex logistical framework that synchronizes vessel movement with landside cargo discharge.

Vessel Reliability

Performance Metric ~ Measured downtime per scheduled port call defines this quantitative standard.

Liner Performance

Schedule Reliability ~ Maritime schedule reliability quantifies carrier delivery adherence against published terminal arrival windows across global container trades.

Container Scarcity

Inventory Imbalance ~ Logistics networks experience recurring disruptions when the physical supply of intermodal transport units fails to align with the geographic demand of exporters.

Port Congestion

Systemic Bottleneck ~ Marine transit interruption occurs when vessel arrival volume exceeds the capacity of terminal infrastructure to process cargo, leading to extended wait times at anchorage or within berths.

Freight Rate Inflation

Cost Escalation ~ Sustained increases in transportation costs occur when the price of moving goods across sea, air or land rises over a prolonged period.

TEU Supply

Container Availability ~ Global logistics relies on the total count of twenty foot equivalent units present within an operational zone at a specific moment.

Ocean Trade Delays

Transit Variance ~ Maritime intervals represent the time elapsed between scheduled port arrivals and the actual docking of a vessel.

Transpacific Freight

Operational Volume ~ Transpacific Freight designates the total cargo movement across the northern Pacific Ocean between Asian manufacturing centers and North American destination ports.

Lead Time Variability

Operational Variance ~ Unpredictable schedule fluctuation in cargo movement measures the temporal deviation between promised transit windows and actual dock arrivals.

What the firm knows, published

Expertise is a utility, not a secret. sentiention™ publishes its working knowledge as open reference: intelligence layer covering the materials it sources, the markets it enters, and the reference that serves both.